Storage and Delivery Updates
We manage a complex water supply system stretching from the Sierra to the City and featuring a complex series of reservoirs, tunnels, pipelines, and treatment systems. Two unique features of this system stand out: the drinking water provided is among the purest in the world; and the system for delivering that water is almost entirely gravity fed, requiring almost no fossil fuel consumption to move water from the mountains to your tap.
We are the third largest municipal utility in California, serving 2.7 million residential, commercial, and industrial customers in the Bay Area. Approximately one-third of our delivered water goes to retail customers in San Francisco, while wholesale deliveries to 27 suburban agencies in Alameda, Santa Clara, and San Mateo counties comprise the other two-thirds.

Hetch Hetchy Regional Water System
The Hetch Hetchy watershed, an area located in Yosemite National Park, is the major source of water for all of San Francisco's water needs. Spring snowmelt runs down the Tuolumne River and fills Hetch Hetchy, the largest reservoir in our water system. The surface water in the Hetch Hetchy Reservoir is treated, but not filtered because it is of such high quality.
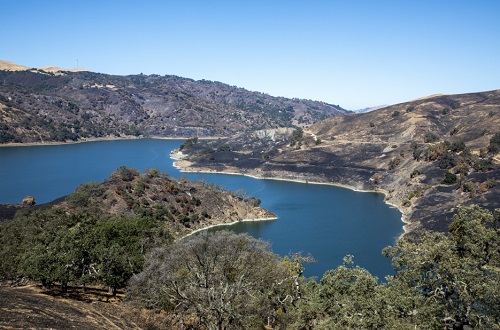
Together the Alameda and Peninsula watersheds produce the rest of the total water supply. The Alameda watershed, located in Alameda and Santa Clara Counties, contributes surface water supplies captured and stored in two reservoirs: Calaveras and San Antonio. The Sunol Filter Galleries located near the Town of Sunol, are a groundwater source supplying less than one percent of San Francisco's water. In San Mateo County the Peninsula watershed contributes surface water supplies captured and stored in lower and upper Crystal Springs and San Andreas Reservoirs and in two smaller reservoirs, Pilarcitos and Stone Dam. The 6 reservoirs in the Alameda and Peninsula watersheds capture rain and local runoff. Some also store Hetch Hetchy water for use by San Francisco. These local water sources and groundwater from the Sunol filter galleries are treated and filtered before delivery.
Regional Water System Data Viewer
We Deliver
Discover exciting data such as how much rainfall we’ve had in the last weeks, how much water we have in storage, and how our customers are using our water and power services. The data is in graph form below but we’ll explain what each graph means so that you’ll want to return to follow our tracks!

