When the San Francisco Public Utilities Commission (SFPUC) launched the 100-Year Storm Flood Risk Map in 2018, the goal was to inform San Francisco property owners and tenants about stormwater flood risk so they can take actions to protect their property and belongings. The next step was a 2019 ordinance requiring sellers and landlords to disclose if a property lies in the Flood Map’s risk zone. Now we’ve added a new layer of data called flood elevations to the Map. Here’s why we’re providing the data and how it helps make San Francisco a more flood-resilient city.
Understanding the SFPUC Flood Map
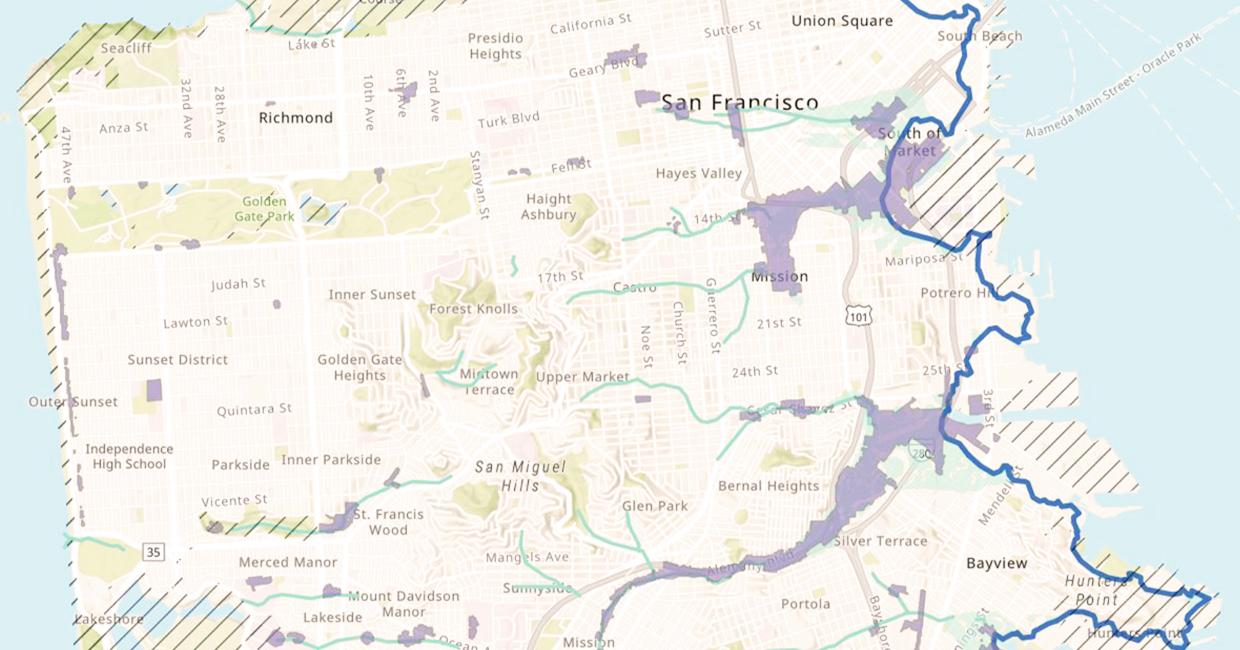
The SFPUC created the 100-Year Storm Flood Risk Map using computer modeling based on historical storm data. The Map depicts areas that experience flooding at least six inches deep during a “100-year storm.” This is a term used by scientists and engineers to describe an intense storm that statistically has a 1 percent probability of occurring at a particular location in any year. Despite this statistical likelihood, such intense storms can and do occur more frequently, sometimes within just a few years of each other or even within the same year.
The Flood Map shows flooding due to stormwater runoff, not other potential flooding sources, such as water coming in from San Francisco Bay or the Pacific Ocean.
Why We Added Flood Elevations
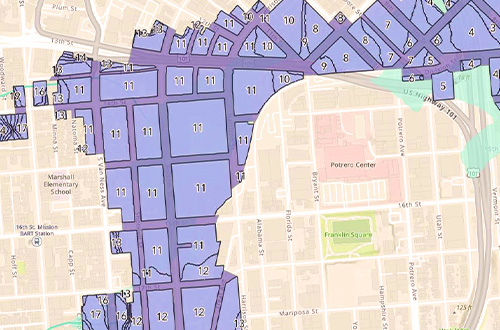
Flood elevation refers to the height (rounded to the nearest foot) that stormwater flooding is likely to reach at a specific location during a 100-year storm. Flood elevation height is measured from the San Francisco City Datum, a consistent reference point for vertical measurements used by the design and development industry in San Francisco. This is different from flood depth, which is measured from ground level.
The San Francisco City Datum is below ground in most parts of the city. Flood elevations include ground elevation, so they are higher in parts of the city where ground level is higher. Flood depth may be, for example, only one foot above ground level, where flood elevation may be anywhere from 10 to 300 feet above the San Francisco City Datum.
Knowing flood elevations for a 100-year storm enables architects and engineers to design more flood-resilient buildings. Residential space can be placed above the flood elevation while structures below can be flood proofed. Some designers who practice flood-resilient design have already asked us for flood elevations in the past. The Flood Map now provides them.
Other Flood Resilience Efforts
San Francisco’s hilly topography includes many low-lying areas that are prone to flooding during heavy rains. Although our stormwater collection system greatly reduces flooding, no system can handle the heaviest of storms. The SFPUC is investing over $600 million to expand the capacity of the system in specific low-lying areas.
As a City, we are also advancing policies, projects, and programs to improve flood resilience across San Francisco. We have made great progress incorporating flood resilience into planning and approvals for new developments through the City’s Stormwater Management Ordinance. We’re using green infrastructure to make our urban surfaces more permeable, so the city can absorb stormwater like a sponge. The City is also exploring the potential to update San Francisco’s Building Code to require flood-resilient design in the 100-year storm flood risk zone, based on these flood elevations. Being mindful about what, where, and how we build is one part of a multi-pronged approach to increase flood resilience.
Property owners can take advantage of our Floodwater Grant to protect their properties if they’ve experienced storm-related flooding, our Green Infrastructure Grant for large properties, and lower-cost flood insurance through San Francisco’s participation in the National Flood Insurance Program. Learn more about rainy season resources.
Learn more about the SFPUC Flood Map and see the Map itself.